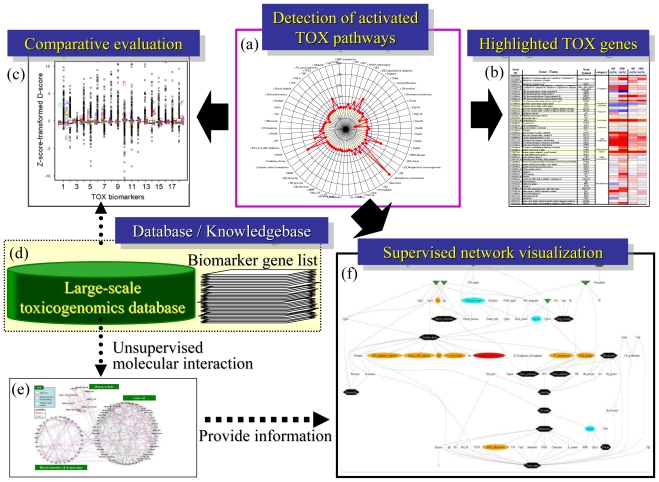
Figure 8.
Analytical flow for toxicity evaluation using TGx data. (A) Radar chart for D-scores using 58 gene sets; (B) Box plot for comparative analysis using a reference TGx database; (C) Heat map for individual genes; (D) TGx reference database and TGx biomarker knowledgebase; (E) Unsupervised gene set-level network inference to extract toxicological relationships among pathways; (F) Supervised gene set-level network.

