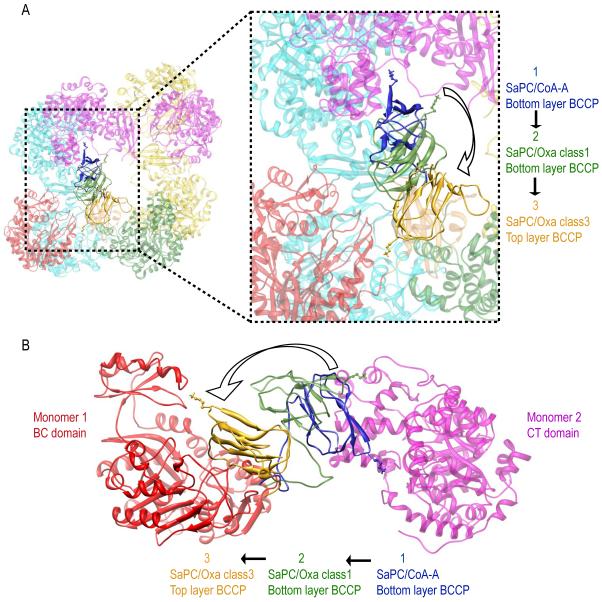
Figure 7.
BCCP transition from the CT active site of the opposite monomer (Monomer 2, in magenta) to the BC domain of its own monomer (Monomer 1, in red). BCCP transition is shown by superimposing the fitted BCCP domains in (i) the bottom layer of SaPC/CoA-A (in blue), (ii) the bottom layer of SaPC/Oxa class 1 (in green) and (iii) the top layer of SaPC/Oxa class 3 (in gold). (A) Top view. (B) Close up lateral view.

