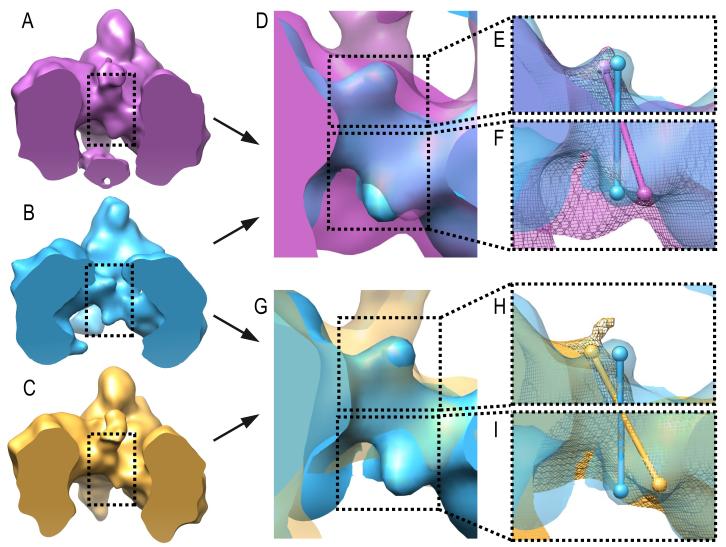
Figure 8.
Movement of the PT domains upon addition of oxaloacetate. (A) Lateral view of the clipped electron density of SaPC/Oxa class 1 (σ = 2.48). (B) Lateral view of the clipped electron density of SaPC/CoA-A (σ = 3.44). (C) Lateral view of the clipped electron density of SaPC/Oxa class 1 (σ = 3.2). (D) Superposition of the electron density maps of SaPC/Oxa class 1 (purple, σ = 2.48) and SaPC/CoA-A (blue, σ = 3.44). (E-F) Close up showing the superposition of the electron density maps of SaPC/Oxa class 1 (purple) and SaPC/CoA-A (blue) on the PT domain located on the top layer and bottom layer respectively. Spheres correspond to the approximate position of the C-terminus of PT domains. (E) SaPC/Oxa class 1 σ = 4.17, SaPC/CoA-A σ = 3.44. (F) SaPC/Oxa class 1 σ = 2.48, SaPC/CoA-A σ = 3.44. (G) Superposition of the electron density maps of SaPC/Oxa class 2 (gold, σ = 3.2) and SaPC/CoA-A (blue, σ = 3.44). (H-I) Close up showing the superposition of the electron density maps of SaPC/Oxa class 2 (gold) and SaPC/CoA-A (blue) on the PT domain located on the top layer and bottom layer respectively. Spheres correspond to the approximate position of the corresponding C-terminal PT domain. (H) SaPC/Oxa class 2 σ = 4.05, SaPC/CoA-A σ = 3.44. (F) SaPC/Oxa class 2 σ = 2.65, SaPC/CoA-A σ = 3.44. See also Figure S6.

