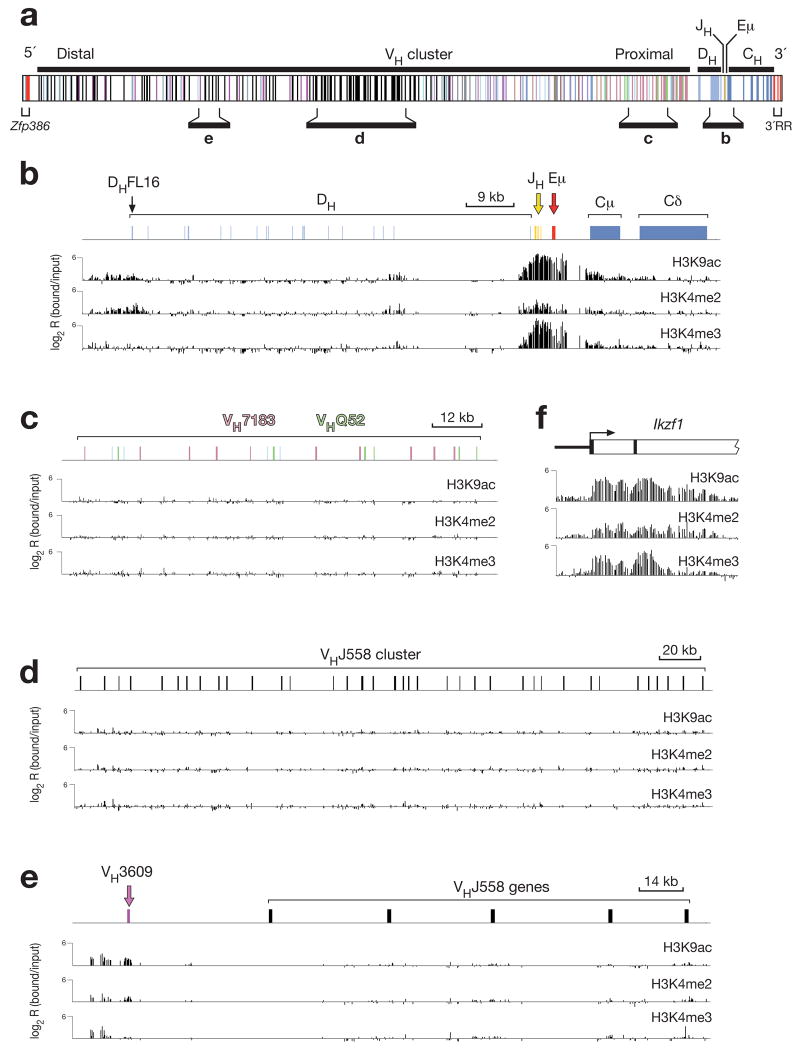
Figure 5. Mapping of active histone modifications along the Igh locus in Rag2−/− pro-B cells.
(a) Structure of the Igh locus indicating the location of variable (VH), diversity (DH), joining (JH) and constant (CH) gene segments together with the intronic (Eμ) enhancer, the 5’ DNase I hypersensitive sites (red) and 3’ regulatory region (3’RR; red). Different colors indicate the members of distinct VH gene families, of which the VHJ558 (black), VH3609 (pink), VHQ52 (green) and VH7183 (rosa) genes are relevant for this study. The diagram of the Igh locus is based on the mm8 genome sequence and the published VH gene assembly19 of the C57BL/6 mouse. (b-f) Mapping of active chromatin marks in the DH-Cμ domain (b) and representative proximal (c) and distal (d,e) VH gene regions of the Igh locus as well as at the 5’ end of the Ikzf1 (Ikaros) gene (f) in Rag2−/− pro-B cells. Antibodies recognizing acetylated lysine 9 (H3K9ac), dimethylated lysine 4 (H3K4me2) or trimethylated lysine 4 (H3K4me3) on histone H3 were used for ChIP-chip analysis31 of Rag2−/− bone marrow pro-B cells, which were expanded in vitro for 5 days in the presence of IL-7 and OP9 stromal cells. The ChIP-precipitated DNA was amplified with the T7-based linear amplification protocol31 prior to fluorescent labeling and co-hybridization with the input DNA probe onto a high-density 50-mer oligonucleotide array containing the mouse Igh locus at 100-bp resolution (produced by NimbleGen Systems). The logarithmic ratio (log2) of the hybridization intensities between antibody-precipitated and input DNA (bound/input) is shown as a bar for each oligonucleotide on the microarray. The results shown are representative of two ChIP-chip experiments, which were performed with independently prepared DNA probes from Rag2−/− pro-B cells. A scale bar is shown in kb. Supplementary Fig. 15 shows the result of a similar ChIP-chip analysis, which was performed with DNA probes amplified with the WGA method32. The mm8 sequence coordinates for the displayed regions of the Igh locus on chromosome 12 are 116,520,000-113,586,000 (a), 113,938,000-113,852,500 (b), 114,234,000-114,086,000 (c), 115,441,500-115,087,000 (d) and 115,859,000-115,780,000 (e).

