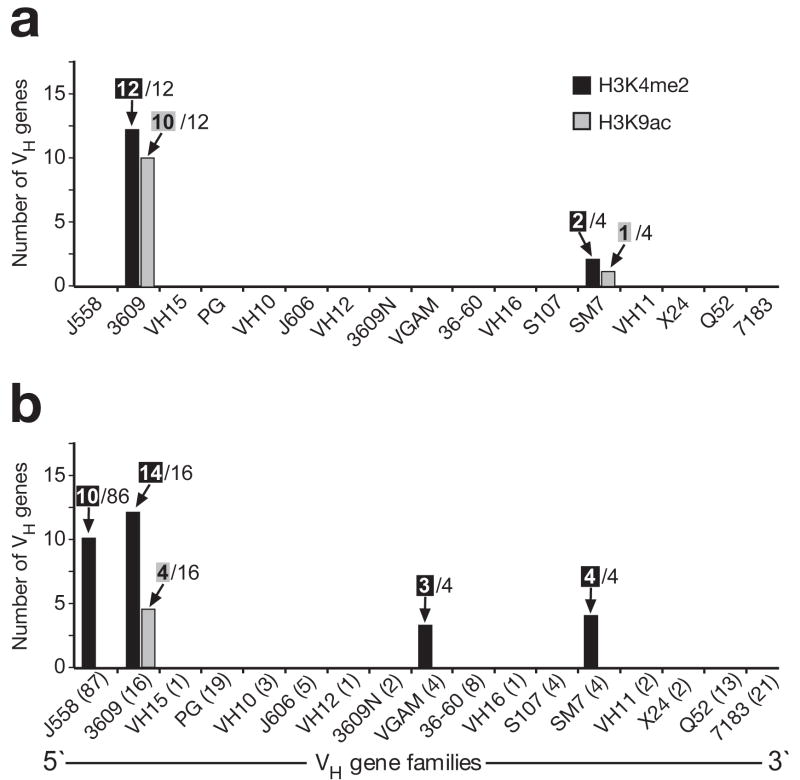
Figure 6. Distribution of active histone marks along the VH gene cluster in Rag2−/− pro-B cells.
Peak-finder analysis was used to systematically evaluate the ChIP-chip data, which were obtained with linearly amplified (a) or WGA-amplified (b) probes as shown in Fig. 5 and Supplementary Fig. 15, respectively. The number of VH genes, which contained a peak of H3K4me2 (black bar) or H3K9ac (gray bar) above the threshold of the peak-finder analysis, are shown together with the number of all genes of each VH gene family that were present on the microarray. The VH gene families are arranged according to their position in the Igh locus. The number of all annotated genes is shown in brackets (b) for each VH gene family of the C57BL/6 mouse19.

