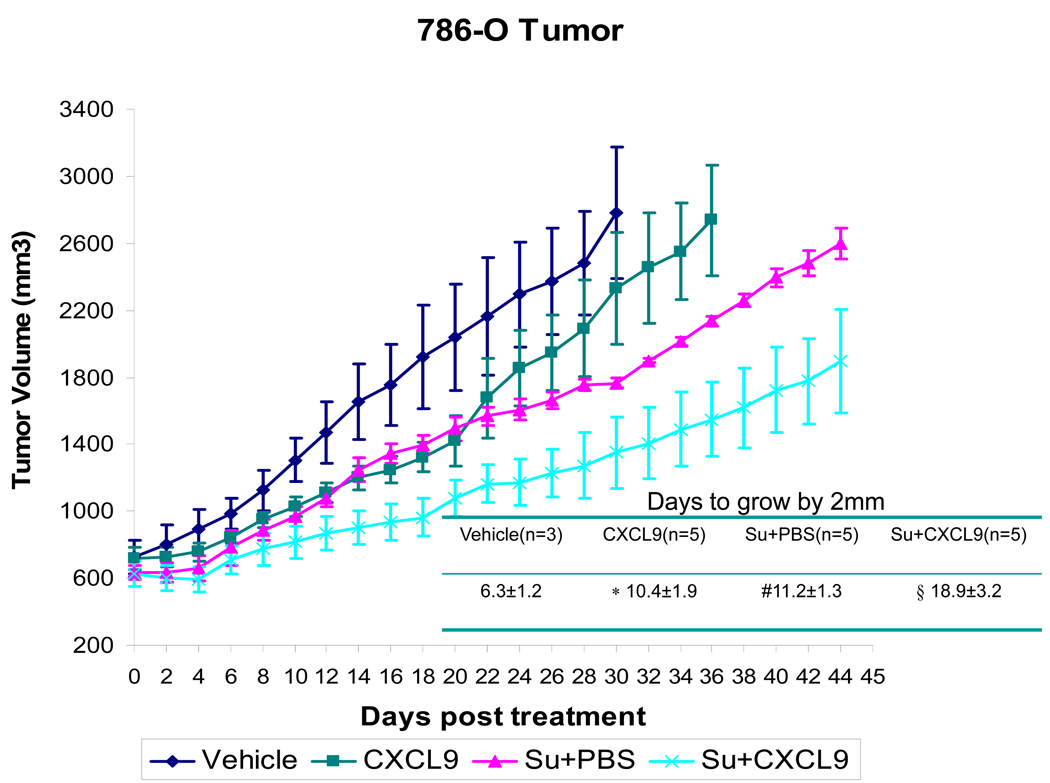
Figure 3.
Growth curves depicting average tumor volume of 786-O derived tumors from mice treated with vehicle gavage (n=3), sunitinib + CXCL9 (n=5), sunitinib+ PBS (n=5), or intratumoral CXCL9 (n=5), are shown with standard error. As compared to vehicle treated controls or sunitinib treated mice, the growth of tumors treated with sunitnib+ CXCL9 exhibit a longer time to resistance shown in the accompanying table (#vehicle vs. sunitinib + PBS: p=0.002, *vehicle vs. CXCL9: p=0.016, § sunitinib + PBS vs. sunitinib + CXCL9 p=0.001). Comparisons were performed by Student’s T-test.

