Figure 5.
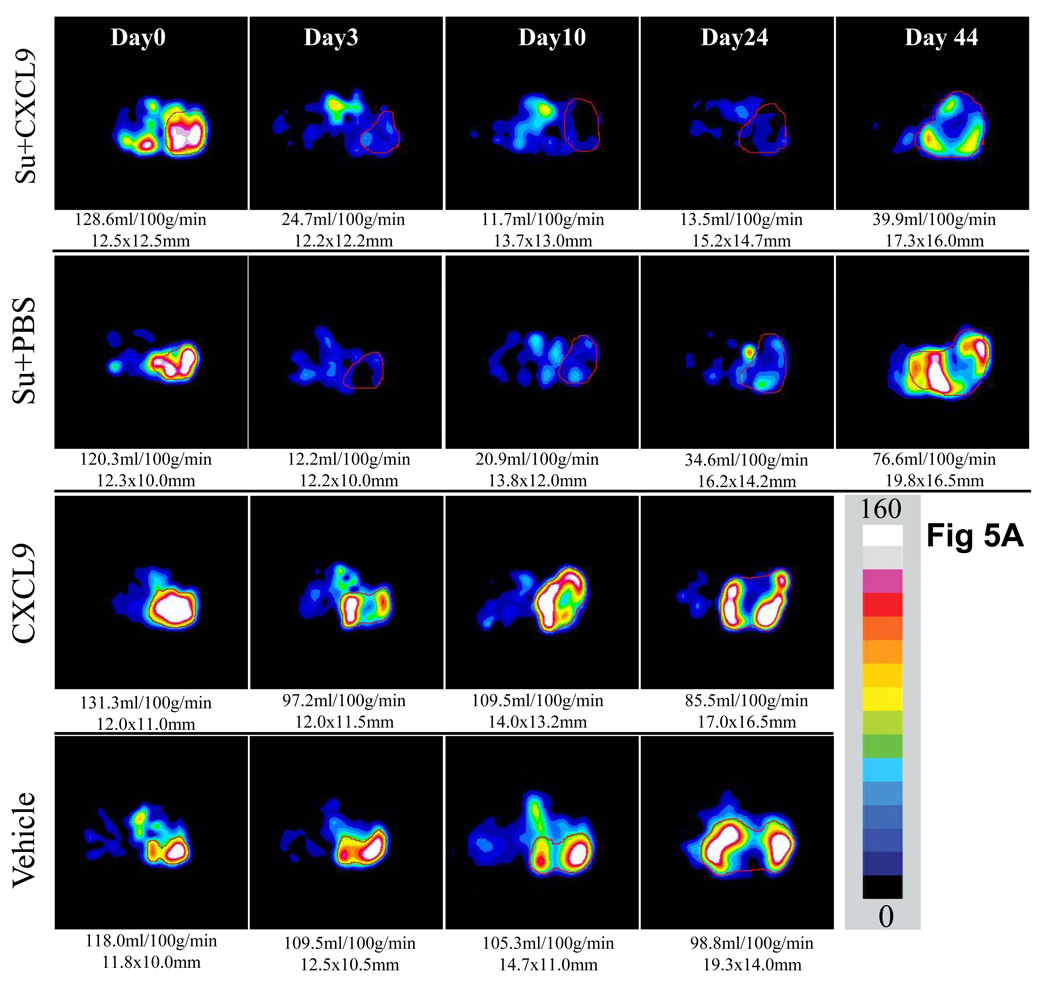
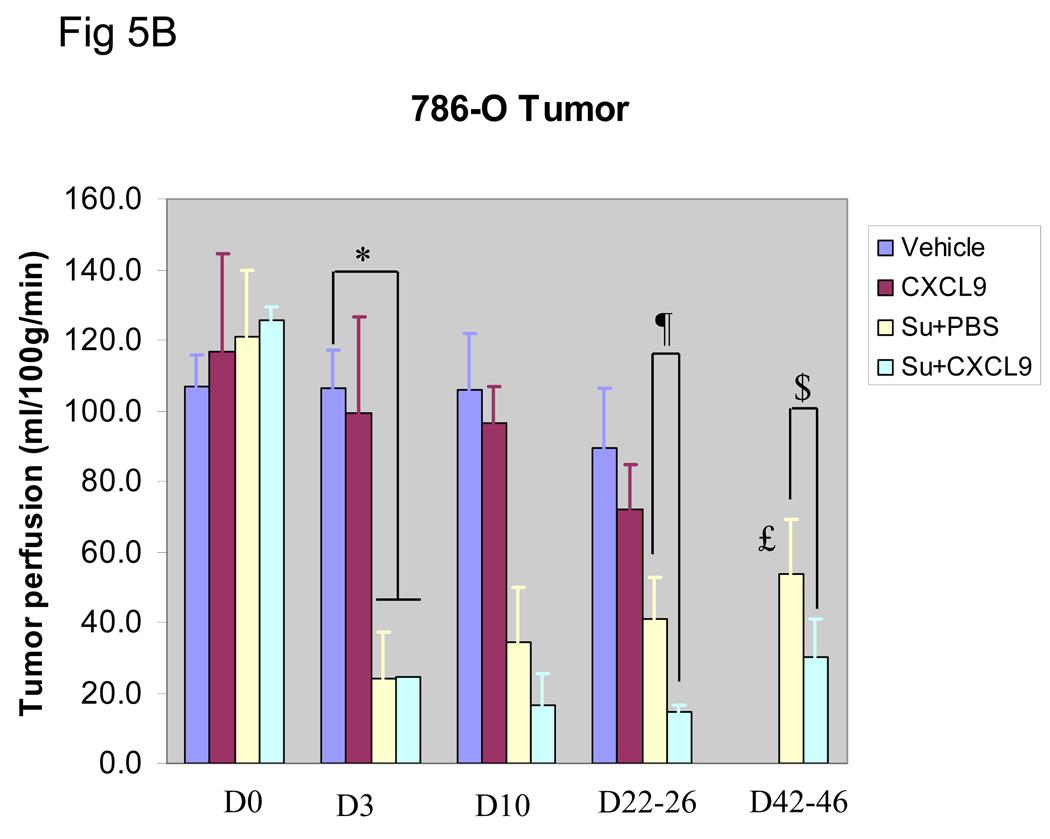
Serial tumor perfusion in a representative tumor treated with Vehicle as control, CXCL9 alone, sunitinib+ PBS, or sunitinib + CXCL9 as measured by ASL MRI is shown in A. The region of tumor is highlighted with red line in each image. The tumor size was measured with long and short axes (in mm) and the mean blood flow (in ml/100g/min) are shown below each image. Color scale represents range of perfusion values from 0 to 160ml/100g/min. In B, average perfusion with standard error is shown (n≥3 mice in all arms). The mice treated with sunitinib + PBS exhibited decreased perfusion that began to resume by week 3 (*P=0.04 for comparison of vehicle vs sunitinib treated mice, £ P=0.03 for comparison of day 3 vs day 45 of therapy with sunitinib + PBS). In contrast, mice treated with sunitinib + CXCL9 exhibited a greater reduction in tumor perfusion than with sunitinib + PBS that was maintained at week 3 (Day 22–26) and week 6 (Day 42–46) (¶ P=0.03 and $P=0.04 respectively).


