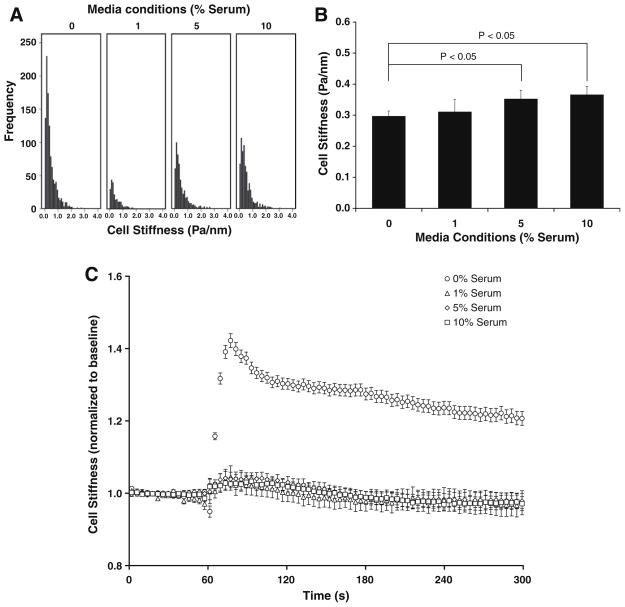
Fig. 1.
(A) The histogram of stiffness data prior to histamine challenge. (B) Baseline stiffness of cells treated with a range of serum. (C) Changes in cell stiffness to 10 μM histamine: for each cell, changes were normalized to its baseline stiffness. Data are reported by descriptive statistics in the form of geometric means, and error bars indicate 95% confidence intervals (n = 229–1068 cells).

