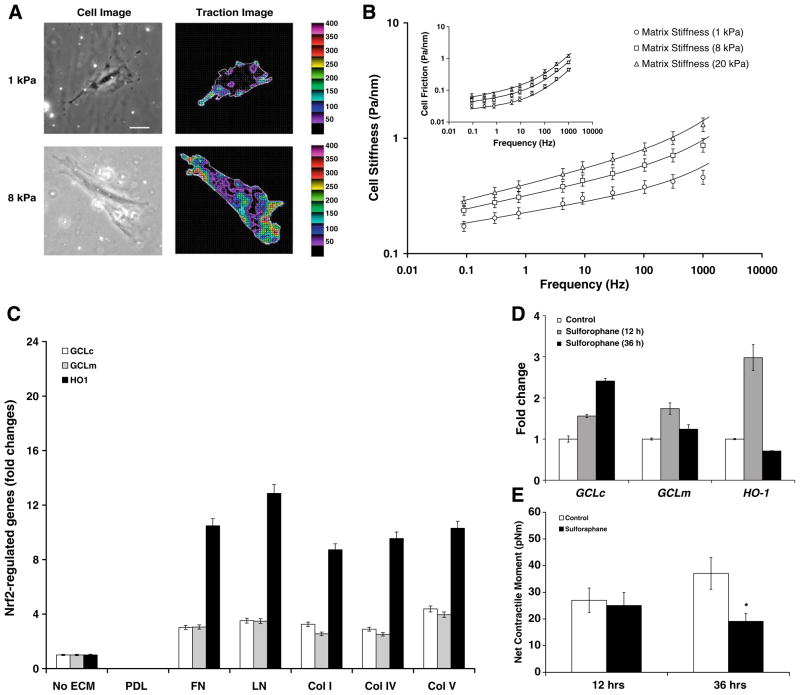
Fig. 3.
(A) A representative phase contrast and traction field images of the single ASM cell adherent upon an elastic gel block (Young’s modulus of 1 or 8 kPa with a Poisson’s ratio of 0.48). Colors show the magnitude of the tractions in Pa, and arrows show the direction and relative magnitude of those tractions. Scale bar, 50 μm. (B) Stiffness and frictional modulus of the adherent cell across a spectrum spanning five decades of frequency. The solid lines are the fit of experimental data with a two-term power-law model [25], G* = G0(if)x−1 + G1(if)¾, where the first term accounts for slow glassy dynamics [20] and the second term for semiflexible polymer fluctuations [25]. Data are presented by geometric means, and error bars indicate 95% confidence intervals (n = 341–372 cells). (C) The basal transcript levels of GCLc, GCLm, and HO-1: cells were adherent upon plastic substrates coated without or with PDL, FN, LN, Col I, Col IV or Col V. (D) Induction of GCLc, GCLm, and HO-1 by Sulforaphane (20 μM): cells were adherent upon elastic gel (8 kPa) substrate coated with Col I. Data are presented as Mean ± SE (n = 3 separate experiments). (E) Net contractile moment of cells treated without or with 20 μM Sulforaphane. Data are presented as Mean ± SE (n = 24–31 cells).

