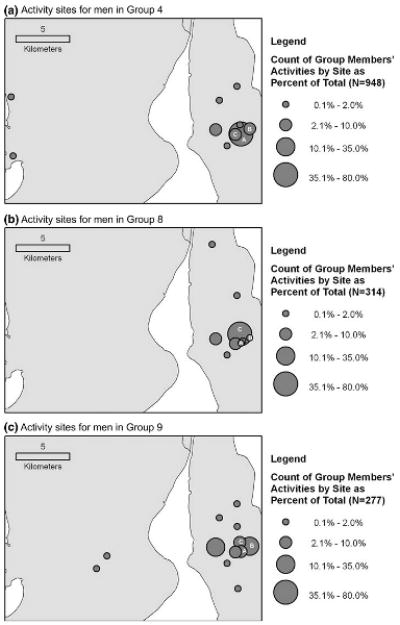
Fig. 3.

Spatial activity patterns for men in Group 4 (a), men in Group 8 (b), and men in Group 9 (c). The total number of activities mapped for the group is given. Mapped locations include usual places for engaging in the eight leisure time activities and locations where men last drank any of five types of alcohol. The graduated symbols corresponding to study Communities A, B, and C are labeled
