
Figure 6.
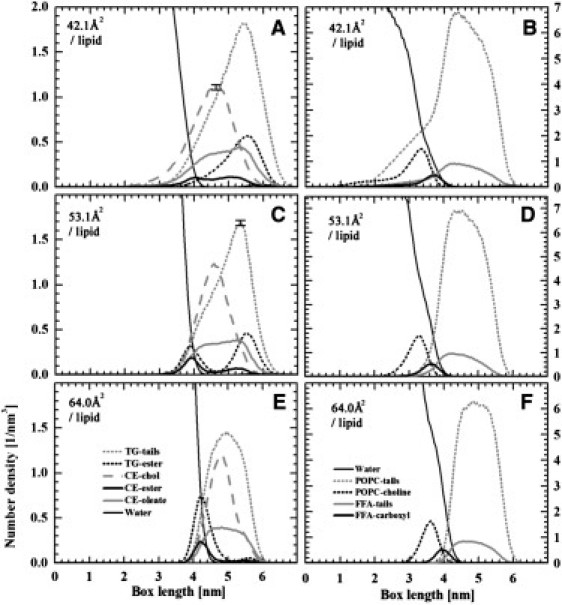
Distributions of number densities along the layer normal direction. The length scale on the x axis ranges from 0 to 7 nm such that the peak of POPC tails has a maximum at approximately the same position in all systems shown here. Water is on the left- and air on the right-hand side of the lipid layer. (A, C, and E) The distributions of POPC and FFA (palmitate), the curves representing the center of mass of the hydrocarbon chains as well as the headgroup carboxyl of FFA and the choline of POPC. (B, D, and F) The distributions of TG and CE, the curves here representing the center of mass of the hydrocarbon chains as well as the ester group of CE and the ester groups of TG. The distributions highlight the formation of hills on the water side of the layer for decreasing area per lipid.