
Figure 3.
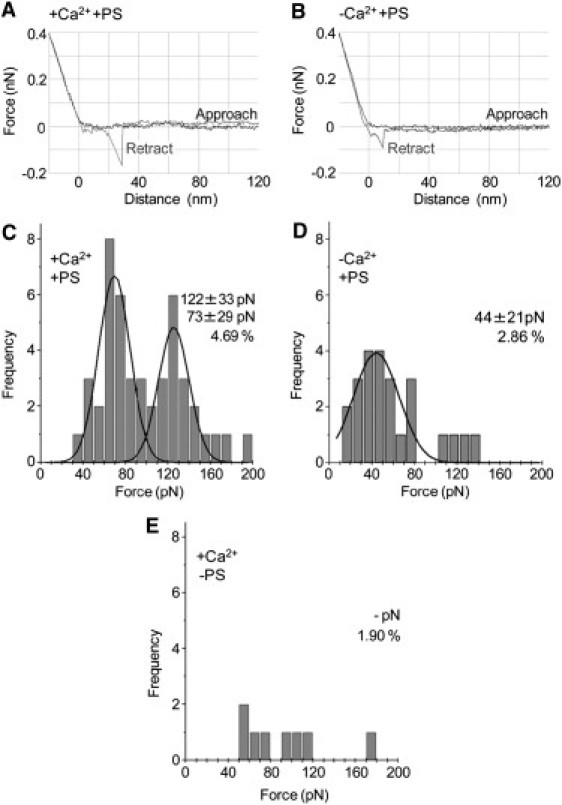
Interaction of wild-type C2AB with PS-containing bilayers in the presence and absence of Ca2+. Typical force curves for the interaction of C2AB with lipid bilayers either in the presence (A) or the absence (B) of Ca2+. The vertical axes indicate cantilever deflections, representing a retraction force from the substrate. The horizontal axes show the distance between the cantilever and the substrate. All force measurements were performed in HBS at room temperature, with a loading rate of 2000 pN/s. To measure single molecule pulling events, only the force peaks that could be fitted to the wormlike chain model of PEG were accepted. (C–E) Frequency distributions of forces for the interaction of C2AB with lipid bilayers either in the presence (C) or absence of Ca2+ (D), and with lipid bilayers composed of 60% DOPC, 30% SM, and 10% cholesterol (i.e., no PS) in the presence of Ca2+ (E). The numbers of accepted force values were 46 (C), 24 (D), and 8 (E). (Curves) Fitted Gaussian functions. The means of the distributions, and the percentage of retractions giving force-extension curves, are indicated.