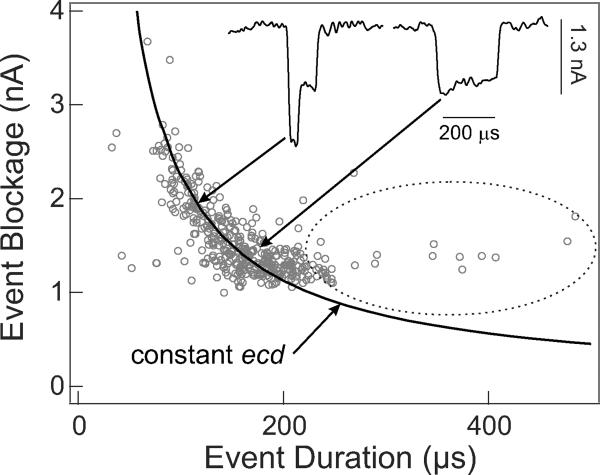
Figure 4. Average nanopore current blockades vs. blockade duration during DNA translocation.
DNA (16 μg/ml) was electrophoretically driven through a 5 nm diameter graphene pore by an applied voltage bias of 160 mV. The graphene membrane separated two fluid cells containing unbuffered 3M KCl solutions, pH 10.4. Insets show typical current-time traces for two translocation events sampled from among those pointed to by the arrows. The hyperbolic curve corresponds to freely translocating events at a fixed ecd12. Encircled events are delayed by graphene DNA interactions.

