Figure 4.
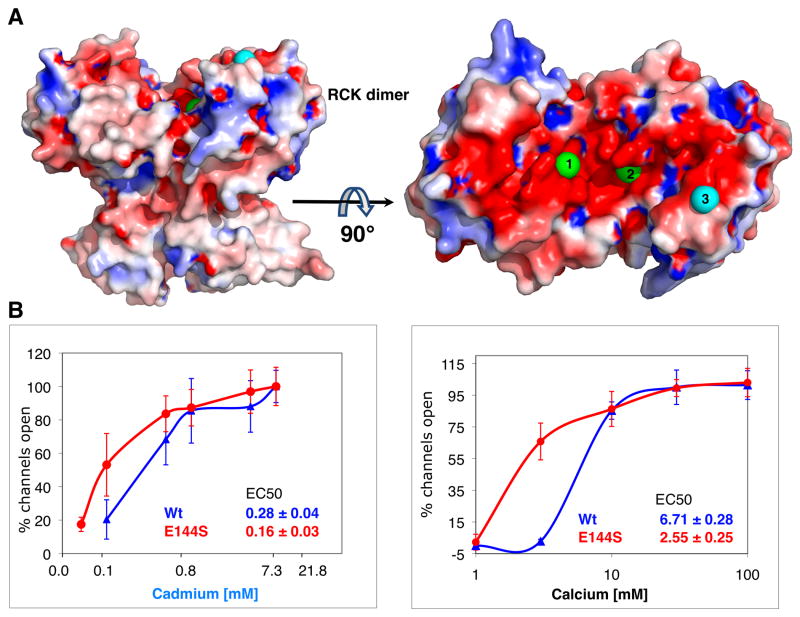
Involvement of a negatively charged surface of RCK in activation. (A) The electrostatic surface of the dimeric RCK (contoured at ± 5 kT/e with negative charges in red and positive charges in blue) is rendered in a similar view as in Figure 1. Rotation of 90° about a horizontal axis shows that the dimer face, at which the cations bind at Sites 1, 2 and 3, is remarkably negatively charged. The two Cd2+ metal ions bound at the calcium-binding sites (1 and 2) are shown as green spheres, while Cd2+ at Site 3 is shown as cyan sphere. (B) Activation curves of wt (blue) and E144S (red) by Cd2+ (left) and Ca2+ (right). Potassium currents were measured via patch-clamp experiments on giant E. coli spheroplasts expressing MthK. The percentages of open channels, averaged from 5 to 10 patches at each concentration (SD are shown as error bars) are plotted against the cation concentrations in logarithmic scale. EC50 values for both Cd2+ and Ca2+ decrease significantly by the E144S mutation (reduction of two charge values per dimer) indicating that the negative charge on this patch promotes the closed state channel.

