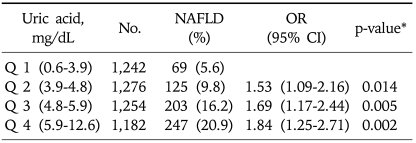
Table 3.
NAFLD Incidence Rate after 5 Years and Multivariate Analysis for the Incidence of NAFLD in Relation to the Serum Uric Acid Level
Date are adjusted for age, sex, fasting glucose, ALT, fasting insulin, BMI, daily alcohol intake, smoking, regular exercise, educational background and BMI change (between 2003 and 2008).
NAFLD, non alcoholic fatty liver disease; OR, odds ratio; CI, confidence interval.
*Chi-square test.

