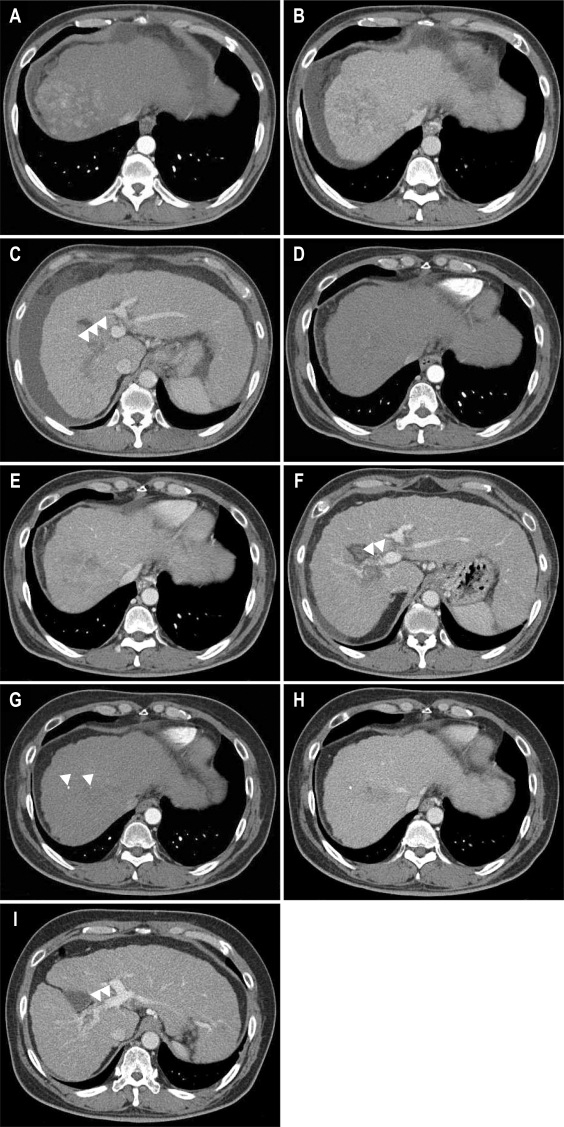
Fig. 1.
Liver dynamic computed tomography images obtained before and after treatment. (A-C) Before treatment. (A) An arterial phase, 8.5×7.5-cm-sized, well-enhanced mass is noted in the hepatic dome. (B) Portal phase, showing mass washout. (C) Portal phase, with the right main portal vein appearing enlarged with massive portal vein thrombosis (arrows). (D-F) Two months after sorafenib monotherapy. (D) Arterial phase, showing that arterial enhancement in the hepatic mass is markedly decreased. (E) Portal phase, showing continued presence of the hypoattenuated mass. (F) Portal phase, showing revascularization of the portal vein thrombosis (arrows). (G-I) Eight months after sorafenib treatment combined with hepatic arterial infusion chemotherapy and transcatheter arterial chemoembolization. (G) Arterial phase, showing no definite arterial enhancement with a tiny amount of lipiodol uptake (arrows). (H) Portal phase, showing a smaller hypoattenuated mass. (I) Portal phase, showing revascularization of the portal vein thrombosis (arrows).

