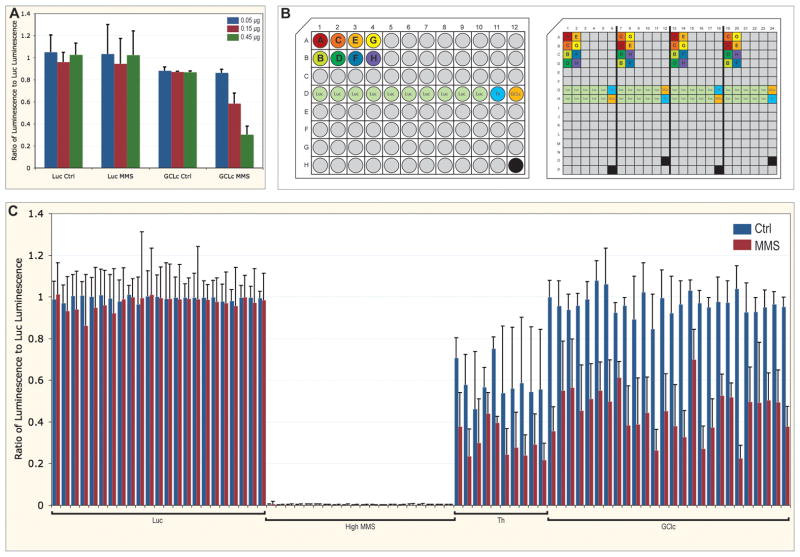
Figure 1.
Arrangement and analysis of validation experiments. A. Ratio of viability of cells with dsRNA targeting GCLc normalized to cells with non-targeting dsRNA against luciferase, with and without MMS treatment. Concentrations of dsRNA targeting GCLc were 0.05 (blue), 0.15 (red), and 0.45 μg (green). Error bars are standard deviation for quadruplicates. B. Layouts of the 96-well stock plate and 384-well assay plate. Unique dsRNA are filled grey, with eight of these labelled A through H and colored. Controls of dsRNA against luciferase (Luc, green), Thread (Th, light blue), and GCLc (orange) are also indicated. The black wells are empty. In the stock plate, each dsRNA is represented only once, except dsRNA targeting Luc. The assay plate is aliquoted using a robot with an eight-channel pipettor, and is comprised of four copies of the stock plate, with a distributed pattern to reduced edge effects (notice positioning of dsRNA A through H, this pattern is continued for all grey (unique) dsRNA). In the assay plate, a high concentration of MMS is added to the empty well. C. Ratio of viability of embedded controls in assay plates, with (red) and without (blue) MMS treatment, normalized to the median Luc value for each plate. Error bars are standard deviation for 40 replicates (Luc) or quadruplicates (high MMS, Th, and GCLc).

