
Fig. 4.
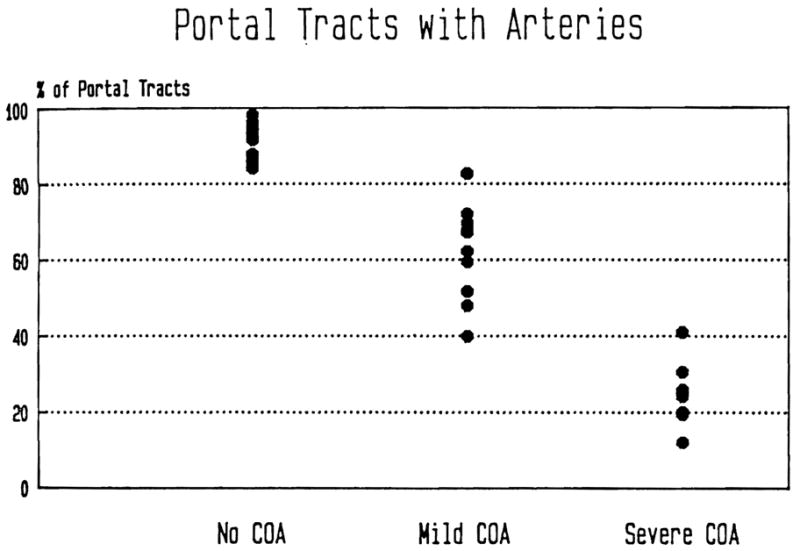
The percentage of portal tracts from normal control and failed allograft livers containing at least one identifiable artery is represented. Note the absolute loss of identifiable portal arteries in failed allografts.
Official websites use .gov
A
.gov website belongs to an official
government organization in the United States.
Secure .gov websites use HTTPS
A lock (
) or https:// means you've safely
connected to the .gov website. Share sensitive
information only on official, secure websites.
The percentage of portal tracts from normal control and failed allograft livers containing at least one identifiable artery is represented. Note the absolute loss of identifiable portal arteries in failed allografts.