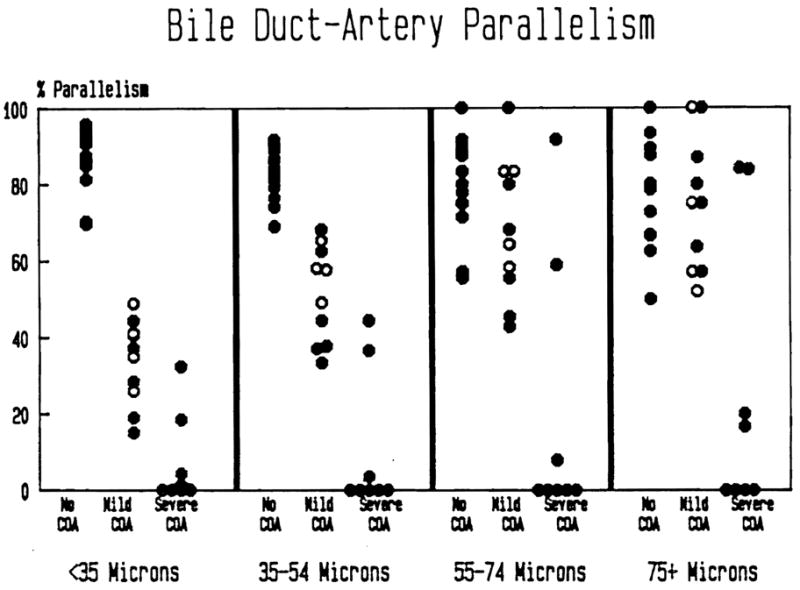
Fig. 6.

The percentage of portal tracts in which a bile duct is identified along with the corresponding artery is represented. Note the severe loss of small bile ducts in the failed allografts. Duct loss corresponding to larger arteries is seen only in allografts with severe COA. Patients with PBC prior to transplantation are represented by the open circles.
