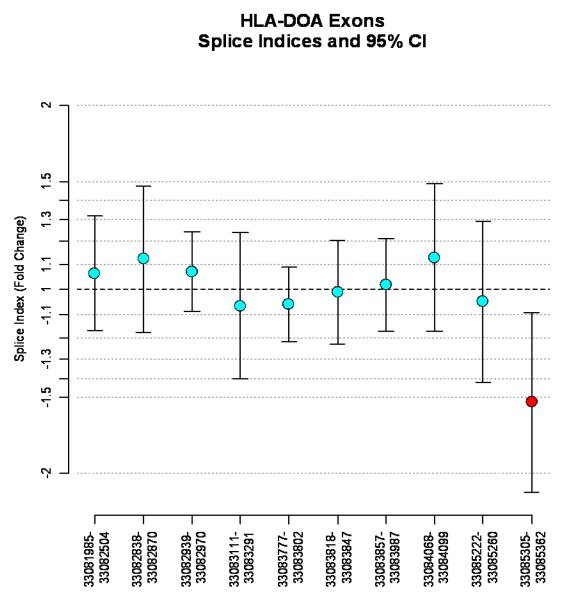
Figure 2.
Splicing index values, defined as the fold change between mean gene-level normalized exon intensities in the Rejector and Non-Rejector groups and 95% confidence intervals for the 10 exons that map to the HLA-DOA gene. The physical position ranges of each exon are represented on the x-axis and any exon point with a significant p-value (p<.05) is shaded red. Significant negative fold changes represent exon skipping or repression, while significant positive fold changes represent exon enrichment for the gene.

