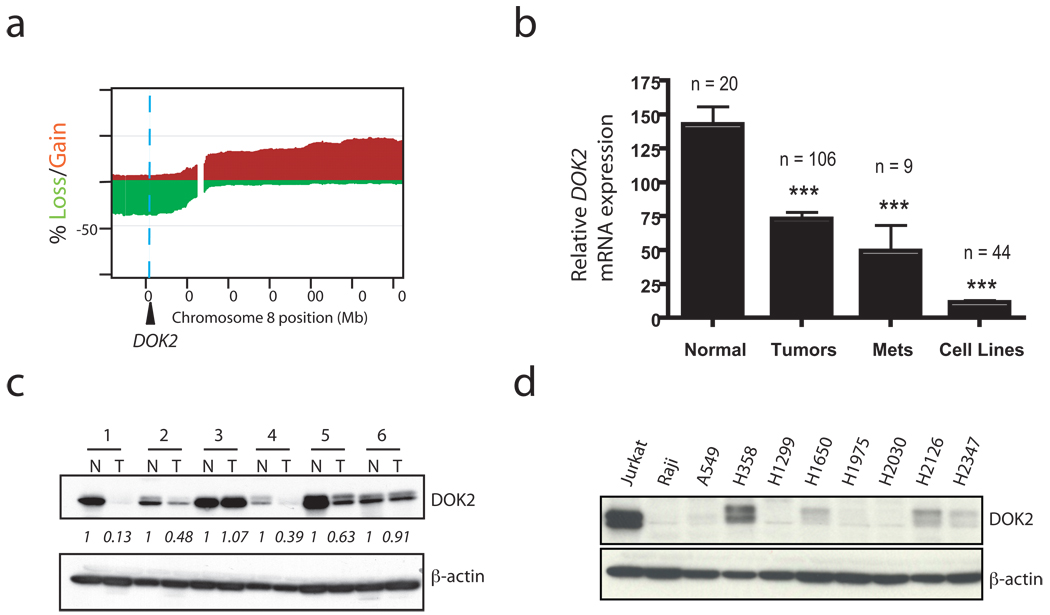
Figure 5. Loss of DOK2 expression in human NSCLC and functional data implicate DOK2 as a human lung tumor suppressor.
(a) Frequency of chromosome 8 copy number aberration determined by aCGH analysis of 199 primary human lung adenocarcinoma samples. Shown is the percentage of samples with loss (green) or gain (red) of a particular genomic locus on chromosome 8. Regional gain/loss was defined with a log2 ratio threshold of +/−0.15. A blue dashed line indicates the genomic position of DOK2. (b) DOK2 mRNA expression from a microarray of primary lung adenocarcinoma samples, lymph node metastases, cell lines, or normal lung (control). ***, P < 0.001 by two-tailed t-test. Data shown is mean + SEM. (c) Western blot of DOK2 protein or β-actin (loading control) in paired lysates from primary human lung tumors (T) and adjacent normal lung from the same patients (N). Relative abundance of DOK2 was quantified using ImageJ software. The numbers represent the ratio of DOK2 to actin expression after normalization by setting the value of each N sample to 1. (d) Western blot of DOK2 or β-actin (loading control) in human NSCLC cell lines. Jurkat and Raji cells were used as a positive and negative control, respectively. See Supplementary Figure 5d for the relative expression in these lines compared to normal, primary human lung tissue.

