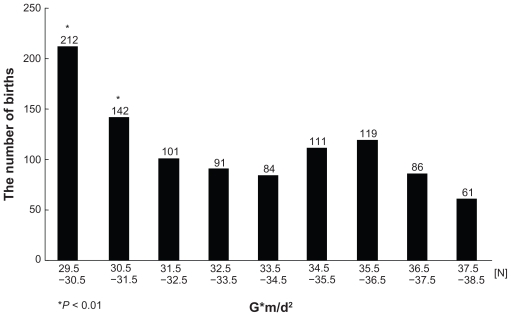
Figure 3.
This Figure shows the relation of the gravitation of the moon and the number of births. The number of births is shown on the each bar. The bar graph is increasing, when the gravitation of the moon is less than 31.5 N. G*m/d2 was used as an index of the universal gravitation.
Notes: *Shows P < 0.01 which is considered as significant difference in Poisson distribution. G: universal gravitation constant, d: the distance from the center of the moon to the center of the earth, m: moon’s magnitude.

