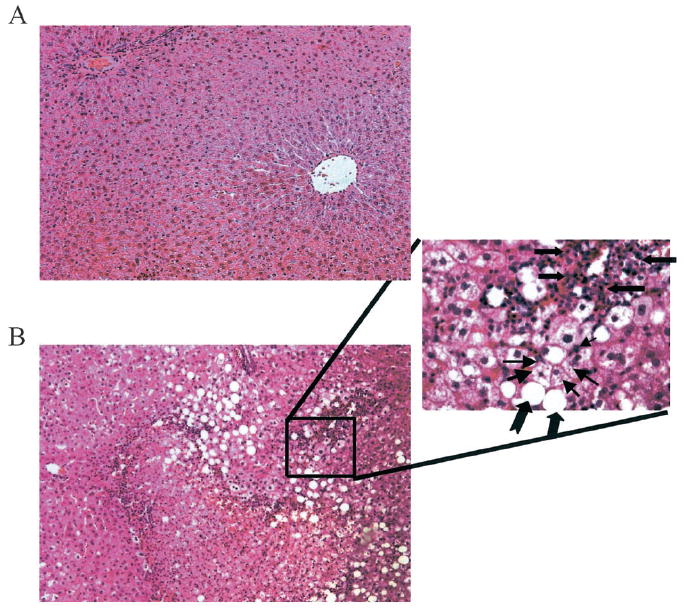
Fig. 1.

Photomicrographs of representative hematoxylin and eosin-stained liver sections prepared from an isocaloric-fed control rat (A) and a rat treated with ethanol for 36 days (B). A 40× magnification of the designated region reveals a foci of inflammatory cells by block arrows. Hepatocytes containing microsteatosis are designated with small arrows, whereas notched arrows designate macrosteatosis. Steatosis in the photomicrograph with 10× magnification (left) is concentrated in the periportal region.
