
Figure 11. Comparison between peptide identification results in the case of database search with narrow or wide peptide mass tolerance.
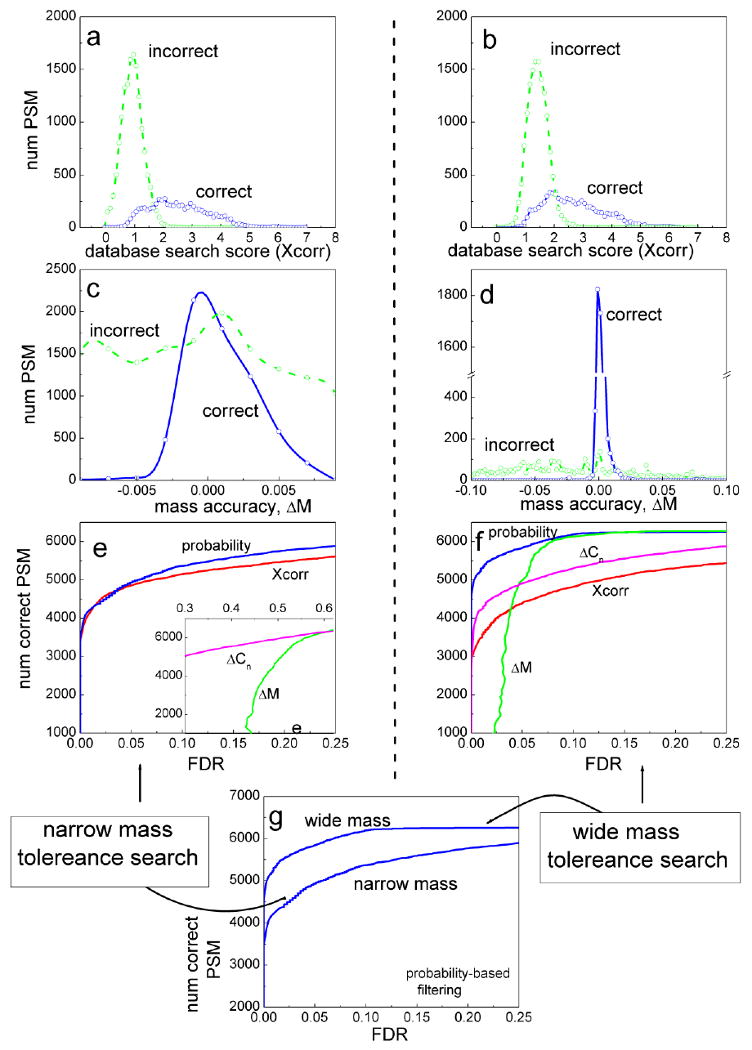
MS/MS data was generated from a control protein mixture using an LTQ-FT instrument (see [161] for details). Spectra were searched with SEQUEST, allowing tryptic peptides only, and with either 0.01 Dalton (left side) or 3 Dalton (right side) peptide ion mass tolerances. (a),(b): the distributions of SEQUEST Xcorr scores among correct (blue) and incorrect (green) PSMs. (c),(d): the distributions of ΔM scores. (e),(f): the number of correct PSMs plotted as a function of FDR that can be obtained by filtering PSMs using cut-offs based on individual scores: Xcorr (red line), ΔCn (purple), ΔM (green), and PeptideProphet computed posterior probabilities (blue). Inset in (e) shows the region of higher FDR values. (g) The number of PSMs identified as a function of FDR in the case of wide and narrow mass tolerance searches (data filtered using posterior probabilities).