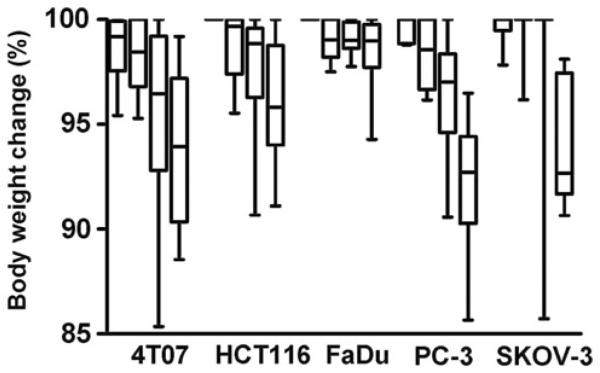
Figure 3.
Maximum decrease in body weight over a period of 60 days after treatment. For each tumour type, control, HT, LTSL-DOX and HT-LTSL-DOX are shown, in that order. Boxes show the upper and lower quartiles and the bar in the box shows the median value. The whiskers demonstrate the range of the data. Body weight recovered for all animals in all groups <20 days after treatment. For all tumour types weight loss was significantly different between treatment groups (Kruskal-Wallis, p < 0.013). The difference between control and HT-LTSL-DOX maximum decrease in body weight was consistently significant for all tumour types ( p < 0.05, Dunn).

