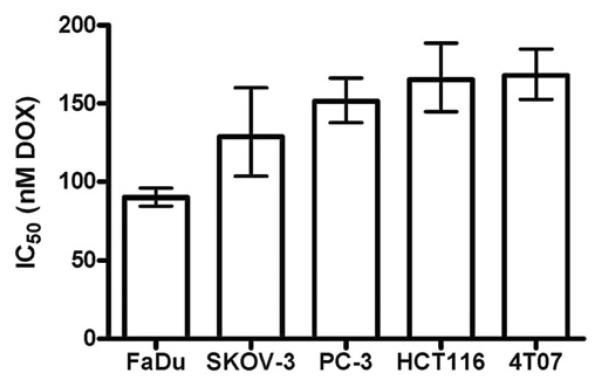
Figure 5.
IC50 values after 24 h exposure to DOX without HT. IC50 values that result from fitting Equation 1 to surviving fraction vs. log[DOX]. R2 was greater than 0.62 for all fitted curves. Comparison of the fitted parameters using the F test shows that the IC50 values in this dataset are statistically different overall ( p < 0.0001). The IC50 of FaDu was significantly smaller than all others ( p < 0.0014, F test). In pairwise comparisons, SKOV-3, HCT116, PC-3 and 4T07 had IC50 values that were statistically indistinguishable from each other, with the exception of a 1.3-fold significant difference between SKOV-3 and 4T07 ( p = 0.02, F test).

