
Figure 5.
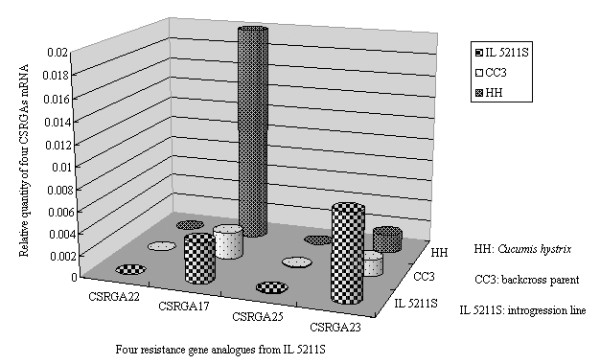
Relative quantitative analysis of four CSRGAs within Cucumis hystrix, CC3, and IL5211S.
Official websites use .gov
A
.gov website belongs to an official
government organization in the United States.
Secure .gov websites use HTTPS
A lock (
) or https:// means you've safely
connected to the .gov website. Share sensitive
information only on official, secure websites.
Relative quantitative analysis of four CSRGAs within Cucumis hystrix, CC3, and IL5211S.