
Figure 7.
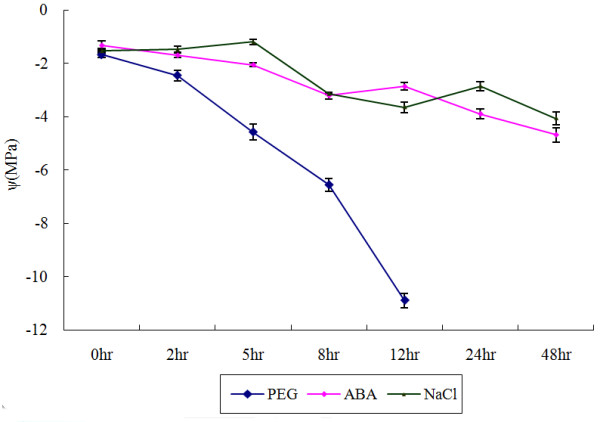
Soybean leaf water potential (ψ) under three treatments: PEG, NaCl, and ABA. The x-axis is the time courses of treatments. The y-axis is water potential of soybean leaf under stress treatments.
Official websites use .gov
A
.gov website belongs to an official
government organization in the United States.
Secure .gov websites use HTTPS
A lock (
) or https:// means you've safely
connected to the .gov website. Share sensitive
information only on official, secure websites.
Soybean leaf water potential (ψ) under three treatments: PEG, NaCl, and ABA. The x-axis is the time courses of treatments. The y-axis is water potential of soybean leaf under stress treatments.