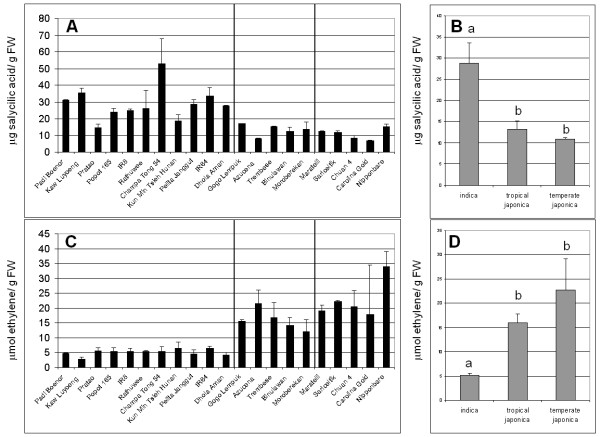
Figure 7.
Preformed quantities of salycilic acid and ethylene in rice cultivars. Constitutive amounts of salycilic acid (A) and ethylene (C) were measured in the absence of infection. Each point represents the mean and standard deviation of two separate assays. The vertical lines separate, from left to right, indica, tropical japonica and temperate japonica genotypes. For each sub-group, the cultivars are displayed from the less to the more resistant. The average values in the different rice sub-groups are also shown for salicylic acid (B) and ethylene (D). The letters (a or b) above the bars indicate whether the average value of salicylic acid levels (B) or ethylene levels (D) are significantly different between each sub-groups as evaluated by a Student tests (P < 0.005)

