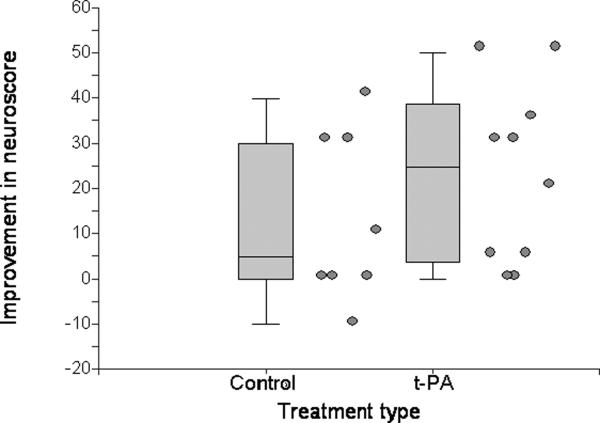
Figure 2.
Improvement in neuroscores between recovery and 24-hours (calculated as Neuroscore-on-recovery minus Neuroscore-at-24-hours) in control and t-PA (tissue plasminogen activator)-treated animals. Individual values are to the right of the associated box plot. A higher value indicates more improvement.

