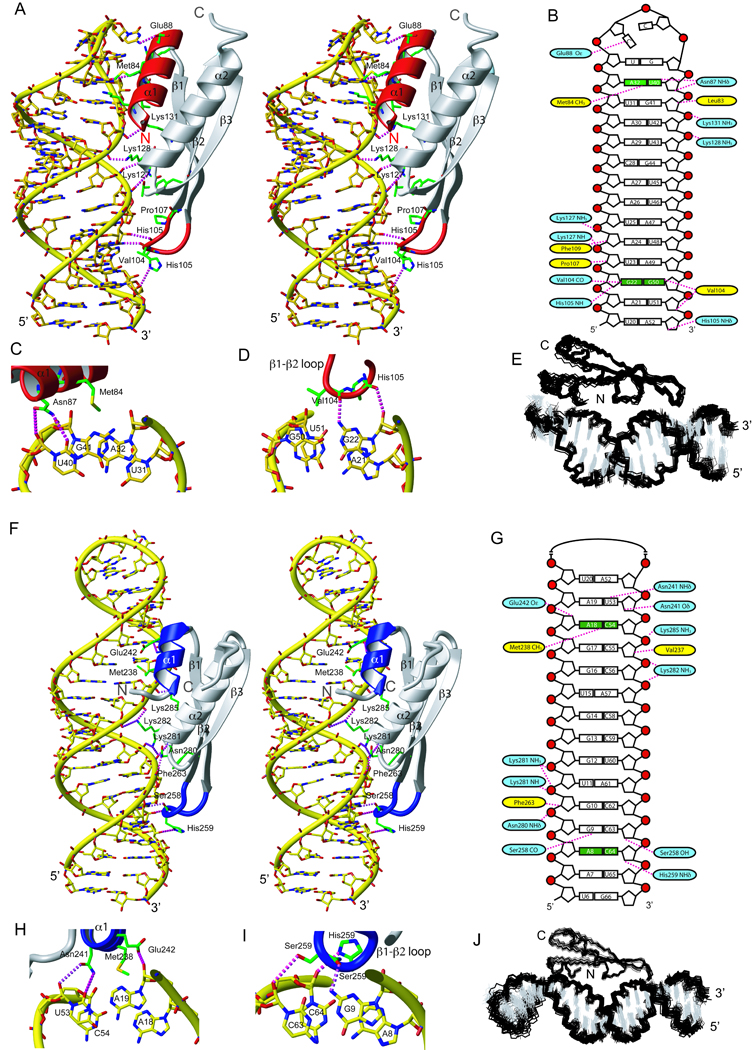
Figure 2.

RNA recognition by ADAR2 dsRBM1 and dsRBM2. (A) Stereo view of the most representative structure of dsRBM1 bound to USL RNA. The RNA is represented as a yellow stick model and the protein is shown as a ribbon model with residues that contact the RNA shown in green. Helix α1 and the β1–β2 loop that mediate the sequence-specific contacts are colored in red. Hydrogen-bonds are indicated by magenta dotted lines (B) Scheme showing contacts between dsRBM1 and the USL RNA. Protein residues that form hydrogen-bonds to the RNA are shown in blue and the one having hydrophobic interactions are in yellow. Close-up view of minor groove sequence-specific recognitions mediated by helix α1 (C) and the β1–β2 loop (D) of dsRBM1. (E) Overlay of the 20 lowest energy structures of the dsRBM1-USL complex. (F) Stereoview of the most representative structure of the dsRBM2 bound to LSL RNA. Helix α1 and the β1–β2 loop that mediate the sequence-specific contacts are colored in blue. (G) Scheme showing contacts between dsRBM2 and the LSL RNA. Close-up view of the minor groove sequence-specific recognitions mediated by helix α1 (H) and the β1–β2 loop (I). (J) Overlay of the 20 lowest energy structures of the dsRBM2-LSL complex. For NMR data of these two complexes, see also Figure S1 and S2.
