Figure 4.
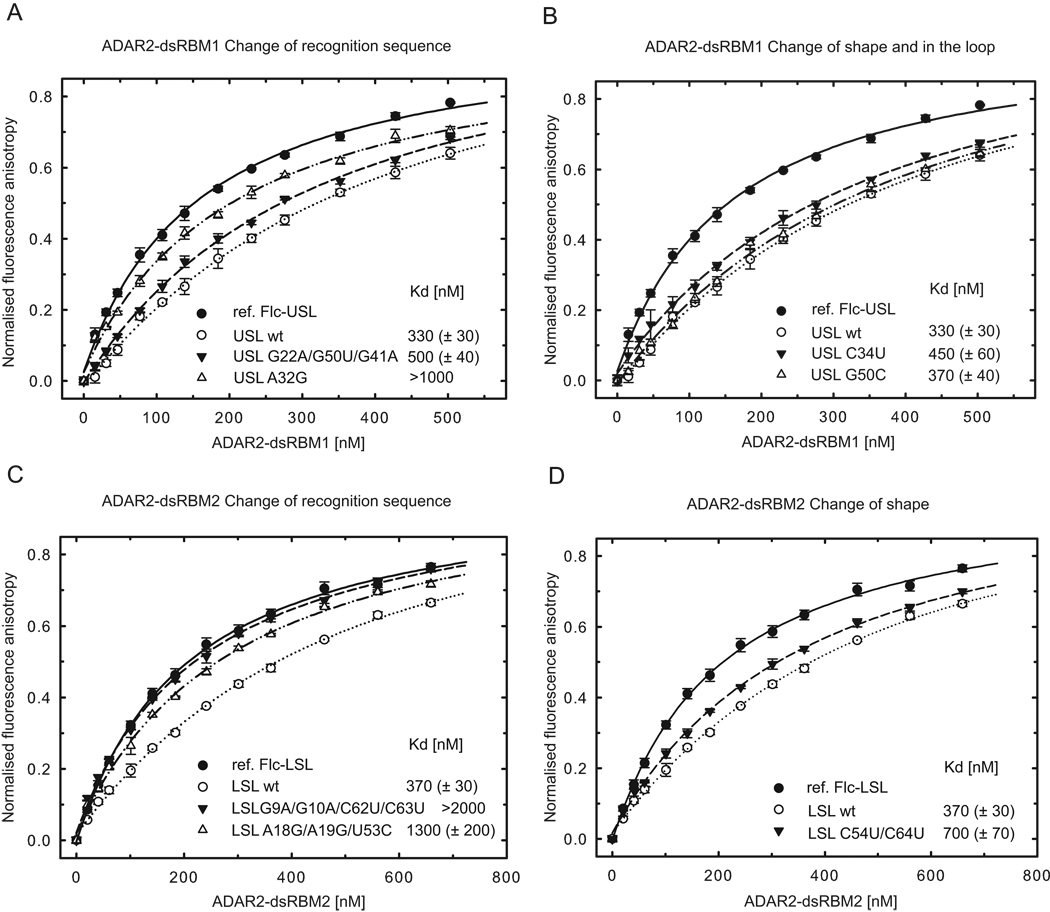
ADAR2 dsRBMs bind preferentially to RNAs that contains their sequence-specific recognition motifs. (A) ADAR2 dsRBM1 was titrated with fluorescently labeled USL and binding was measured by fluorescence anisotropy (black circles; fluorescein labeled reference, Flc-USL). The same experiment was then carried out in the presence of competing unlabeled USL wt (○), USL G22A/G50U/G41A mutant (▼), and USL A32G mutant (△). Equilibrium dissociation constants (Kd) were calculated from the best fit to the data as described in Experimental procedures. (B) The same assay as shown in (A) but for USL C34U mutant (▼) and USL G50C mutant (△). (C) ADAR2 dsRBM2 was titrated with fluorescently labeled LSL and binding was measured by fluorescence anisotropy (●; fluorescein labeled reference, Flc-LSL). The same experiment was then carried out in the presence of competing unlabeled LSL wt (○), LSL G9A/G10A/C62U/C63U mutant (▼), and LSL A18G/A19G/U53C mutant (△) (D). The same assay as shown in (C) but for LSL C54U/C64U mutant (▼).Wild-type and mutant sequences are shown in Figure S3.

