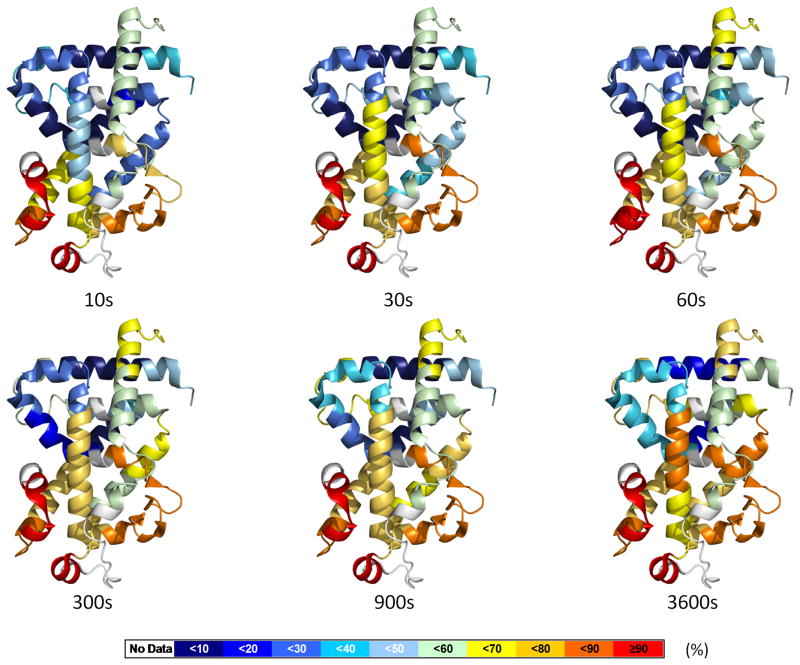
Figure 3.
Dynamics of apo VDR-LBD. The percentage of deuterium levels for all peptides of apo VDR-LBD is mapped with color for each exchange point onto PDB:1DB1; the color code is explained at the bottom of the figure. Regions colored as white represent peptide are not detected. See also Movie S1.

