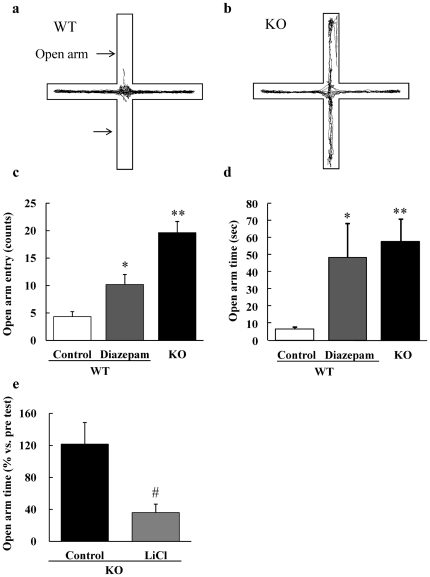
Figure 3. Elevated plus maze test of WT and DGKβ KO mice.
Representative images show typical examples of WT (a) and DGKβ KO (b) mice exploring in the elevated plus maze apparatus. After drug treatment, each group of mice was placed in the elevated plus maze apparatus for 10 min, and the number of entries into (c) and the time spent in open arms (d) were assessed. (e) After 10-days of drug treatment, mice were subjected to the elevated plus maze test again, and their time spent in open arms as a ratio to the pre test was assessed. (n = 7 to 9) *; p<0.05, **; p<0.01 vs. WT mice. #; p<0.05 vs. control mice.

