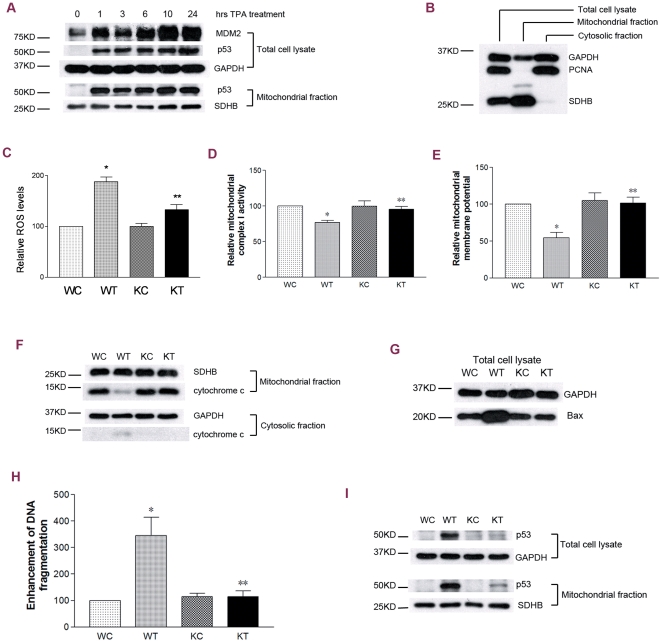
Figure 1. TPA induced p53 mitochondrial translocation, mitochondrial dysfunction and apoptosis in JB6 P+ cells.
WC: wild-type JB6 P+ cells treated with DMSO (control); WT: wild-type JB6 P+ cells treated with 100 nM TPA; KC: p53-knocdown JB6 P+ cells treated with DMSO (control); KT: p53-knockdown JB6 P+ cells treated with 100 nM TPA; GAPDH or SDHB served as the loading control. (A) A time course study of TPA-induced cellular and mitochondrial p53 accumulation, as well as, downstream MDM2 expression. (B) Qualification of mitochondrial fractions. (C) p53 knockdown and ROS levels. Cells were treated for 1 h. (D) p53 knockdown and mitochondrial complex I activities. Cells were treated for 1 h. (E) p53 knockdown and mitochondrial membrane potential. Cells were treated for 1 h. (F) p53 knockdown and cytochrome c release. Cells were treated for 6 h. (G) p53 knockdown and cellular Bax levels. Cells were treated for 6 h. (H) p53 knockdown and cell death levels revealed by DNA fragmentation assays. Cells were treated for 6 h. (I) p53 mitochondrial translocation verified by gene knockdown assays. *: significant difference compared to WC; **: significant difference compared to WT.

