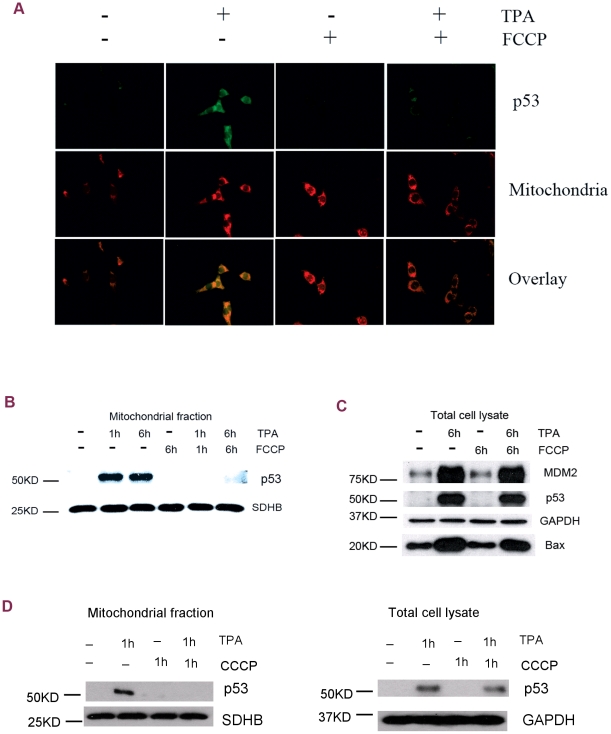
Figure 2. Mitochondrial uncoupling suppressed TPA-induced p53 mitochondrial translocation in JB6 P+ cells.
(A) Immunofluorescent staining of p53 at 30 min after TPA treatment. First panel: p53 detected with an anti-p53 antibody. Second panel: mitochondria labeled with MitoTracker Red. Third panel: overlay pictures. (B) p53 mitochondrial translocation. SDHB served as the loading control. (C) Cellular p53 activation and downstream gene expression. GAPDH served as the loading control. FCCP: 10 µM. (D) Western blot analysis of the mitochondrial (left) and the whole cellular (right) p53 levels after CCCP treatment. CCCP: 5 µM.

