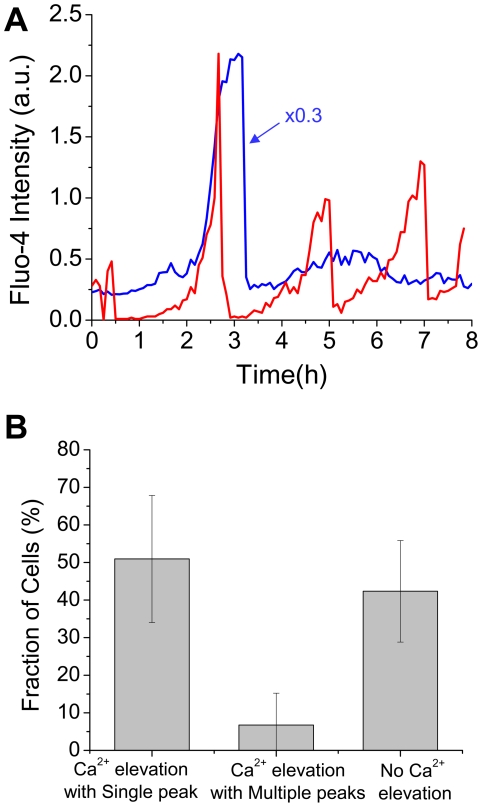
Figure 4. Dynamics of intracellular Ca2+ in RGC apoptosis.
(A) Illustrative examples of intracellular Ca2+ dynamics in two individual differentiated RGC-5 cells during apoptosis under 100 mmHg pressure. One cell shows single Ca2+ peak (blue line) and the other shows multiple peaks (red line). Note that the Ca2+ elevation shows two-stage process of gradual increase over about one to two hours followed by a short transient peak of about 0.5 hour duration. (B) The fraction of cells showing Ca2+ elevation with a single peak, with multiple peaks, and no Ca2+ elevation. Values are mean ± standard deviation from 5 independent experiments.

