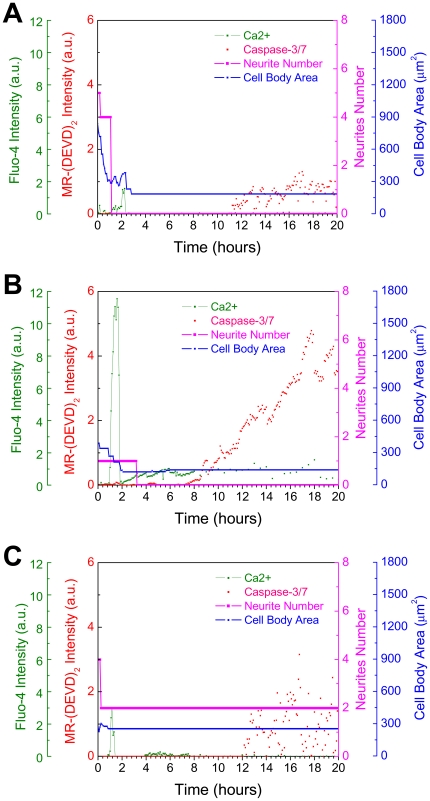
Figure 6. Measured Ca2+ elevation, caspase-3/7 activation and morphological changes in individual cells.
Illustrative plots of Ca2+, caspase-3/7, cell body area, and neurite number in three different cells under 100 mmHg. Panel (A) shows the associated plots of the time-lapse images of the differentiated RGC-5 cell under 100 mmHg inFig. 5 showing Ca2+ peak at the early stage around 2 hour followed by caspase-3/7 activation at the late stage around 11 hour. The plots of the cells in (B) and (C) illustrate the cell-to-cell variation in the time interval between Ca2+ elevation and onset of caspase-3/7 activation. Although Ca2+ peaks occur around 2 h in the both cells, caspase-3/7 is activated around 8 h in the cell in (B) and around 12 h in the cell in (C).

