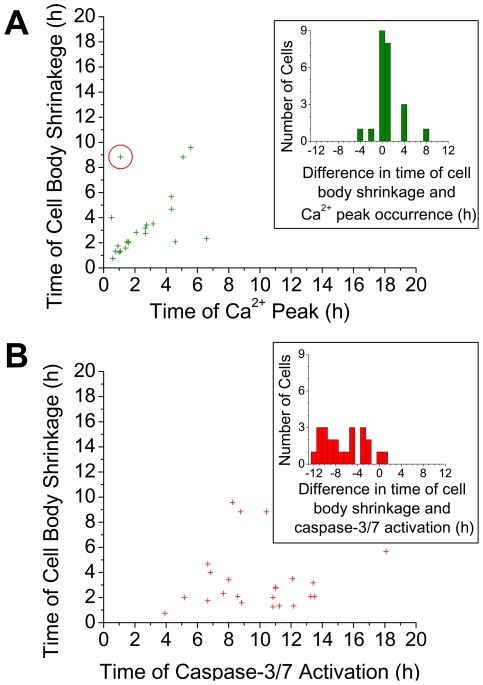
Figure 7. Comparison of the time of cell morphological changes vs. Ca2+ peak occurrence and caspase-3/7 activation.
Plots of the time of cell body shrinkage versus (A) time of Ca2+ peak occurrence and (B) time of caspase-3/7 activation. Insets show the distribution of time difference between the time of cell body shrinkage and (A) the Ca2+ peak occurrence and (B) caspase-3/7 activation. Note that in (A) two data points at coordinate (1.58, 2) overlap. Red circles indicate outliers identified using generalized ESD outlier test (see text). The correlation coefficients between the time of cell body shrinkage versus the time of Ca2+ peak occurrence is 0.66 (significance p = 1E-3) and versus the time of caspase-3/7 activation is 0.06 (p = 0.78).

