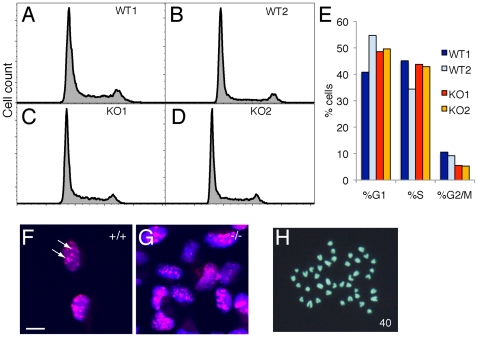
Figure 2. Dicer-null NS cells have minor alterations cell cycle kinetics and significant changes in heterochromatin organisation.
(A–D) Plots of the cell cycle distributions of wildtype (A, B) and Dicer-null (C, D) cells. In both genotypes the majority (∼60%) of cells are in G1, reflecting the relatively slow cycle times for NS cells. Y-axis, cell counts; x-axis, DNA content (Hoechst 33342 fluorescence). (E) Histogram of the proportions of NS cells in each phase of the cell cycle. There is a significant difference in the numbers of cells in G1 in the two control lines, however there is a consistent decrease in the proportion of Dicer-null NS cells in G2/M, compared with controls. (F, G) High-power, confocal images of wild-type (F) and Dicer-null (G) NS cells stained for H3K9Me3. Representative images are shown of the distribution of H3K9Me3 staining in control cells as a relatively small number of large foci (F, arrows). In contrast, the H3K9Me3 distribution is variable in the Dicer-null NS cells, with the majority of cells containing smaller, irregular foci of H3K9Me3 (G). Scale bar, 10 µm. (H) Dicer-null NS cells are karotypically normal, containing the normal complement of 40 chromosomes for mouse and no obvious translocations.

