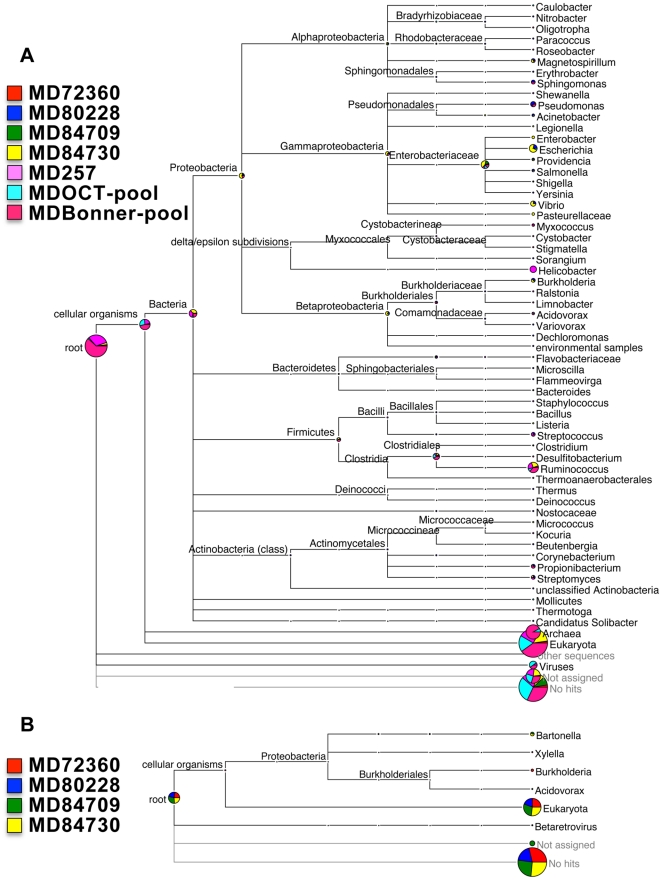
Figure 1. MEGAN comparison of the taxonomic profiles of (A) cDNA transcript-tags from 454 sequencing five individual lymph node samples and two lymph node sample pools and (B) genomic DNA-tags from four individual lymph node samples.
Depicted are assignments with bit score cutoffs ≥50. Circle sizes are scaled logarithmically. Not assigned: sequencing-tags matching to sequences in the NCBI database that are not assigned to taxa; no hits: sequencing-tags not matching to any sequences in the NCBI database.

