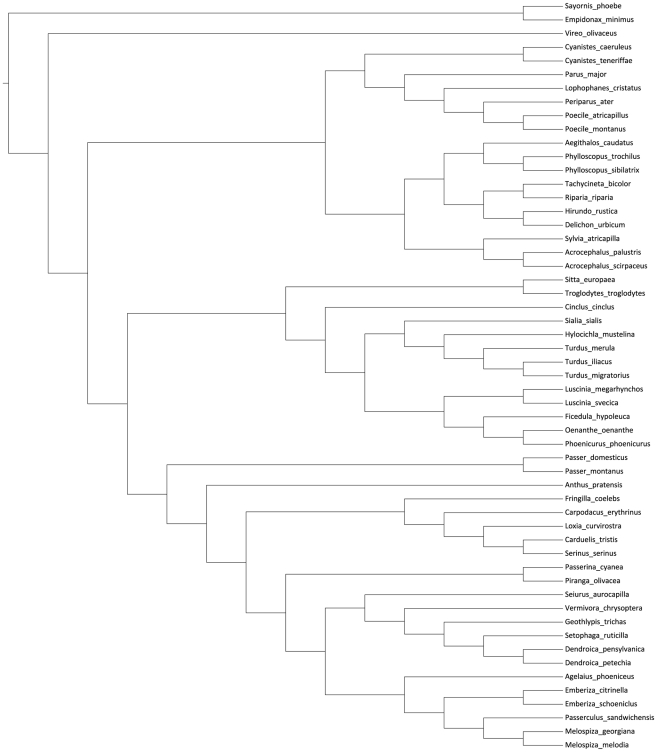
Figure 1. Phylogeny of study species.
The figure illustrates the phylogenetic relationships among the 55 study species. The tree was derived from the most recent advances in avian molecular phylogenetics, with emphasis on studies using multiple genes and broad taxonomic coverage. Explanations and references to the different nodes are given in Materials and Methods.

