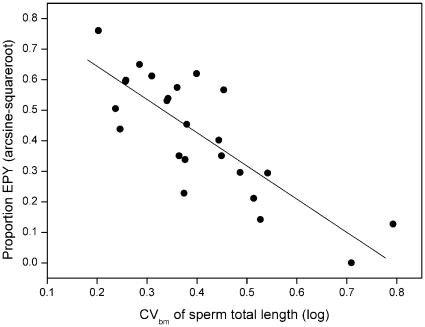
Figure 2. Relationship between extrapair paternity and between-male variation in sperm length.
The figure illustrates the linear regression of the proportion of extrapair young on the coefficient of between-male variation in sperm length (CVbm) for 24 passerine species in which paternity and sperm data originated from the same study population (raw data given in Table S1). Note that transformed values are used. The regression line (y = 0.8614–1.0882×; r 2 = 0.66, P<0.001) was used to calculate predicted extrapair paternity rates from CVbm values for all 55 species in the data set (see Table S1).

