
Figure 4.
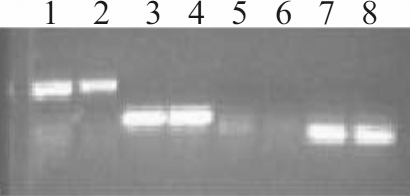
Relative expression of OCTN1, OCTN2, and ATB0,+ in human ocular epithelial cells. Representative image of semi-quantitative RT PCR -amplified human OCTN1, OCTN2, ATB0,+, and ACTB products. In the image, Lanes 1,3,5,7 show HCLE product and Lanes 2,4,6,8 show HCjE product: Lanes 1–2 OCNT1; Lanes 3–4 OCTN2; Lanes 5–6 ATB0,+; and Lanes 7–8 ACTB.