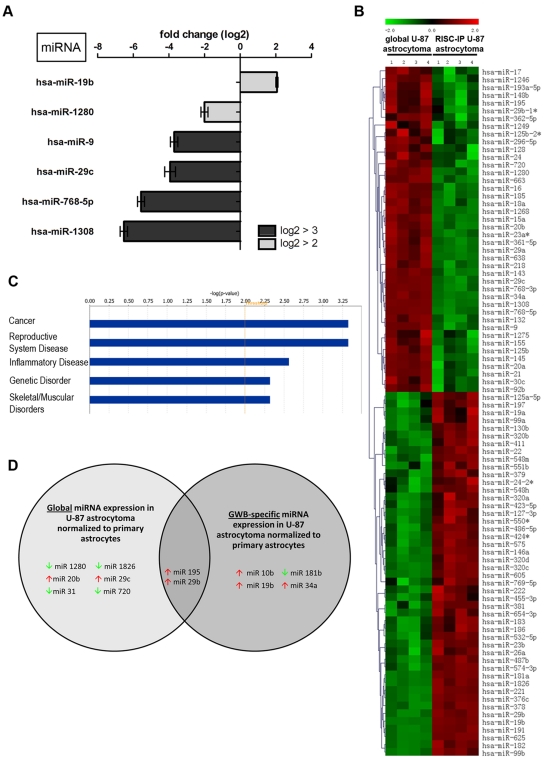
Figure 3. RISC-IP miRNA expression compared to global miRNA expression in human U-87 astrocytoma cells.
(A) MiRNAs with a log2 fold change >2 (p<0.01). MiRNAs with a positive fold change are increased in RISC compared to the global cellular milieu in astrocytoma cells and miRNAs with a negative fold change are decreased in RISC compared to the global cellular milieu in astrocytoma cells. (B) Hierarchical cluster heatmap showing all significantly expressed miRNAs (p<0.01) in four independent samples/cell type. Each row shows the relative expression level for a single miRNA and each column shows the expression level for a single sample. The red or green color indicates relative high or low expression, respectively. (C) Disease/disorders associated with the miRNAs differentially expressed in RISC compared to the global cellular milieu of U-87 astrocytoma cells with a Fisher's exact test p-value threshold set at 0.01 (yellow threshold line) using IPA software. (D) MiRNAs in RISC compared to the global cellular fraction in U-87 astrocytoma cells. U-87 astrocytoma cell miRNA expression was normalized to primary astrocytes miRNA expression. MiRNAs displayed have a log2 fold change >3. Green and red arrows indicate decreased and increased miRNA levels respectively.

