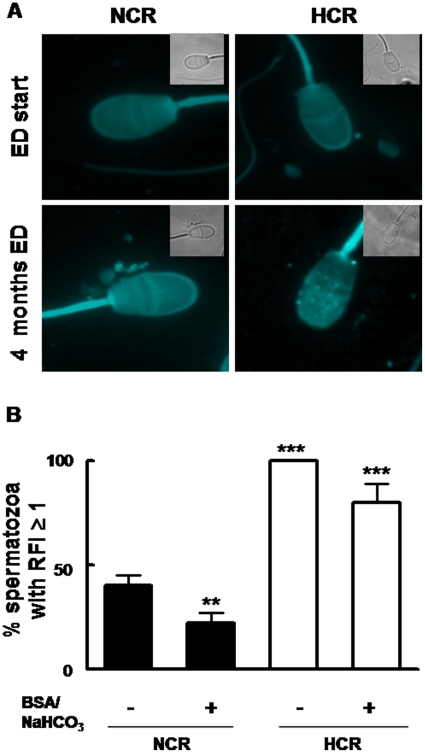
Figure 3. Sperm membrane cholesterol was elevated in HCR.
A: Fluorescence micrographs showing cholesterol content in plasma membrane of ejaculated rabbit spermatozoa detected by filipin probe. Images correspond to phase contrast (inset) and filipin-stained sperm cells (X 600) from NCR and HCR at the beginning of the experiment (first row, ED start) and four months later (second row, 4 months ED). B: Bars represent RFI means (± SEM) in sperm cells isolated from NCR and HCR as described in “Materials and Methods”, from both conditions, non capacitated (- BSA/NaCOH3) and capacitated (+ BSA/NaCOH3). Asterisks = significantly different from control (**, p<0.01, ***, p<0.001).

