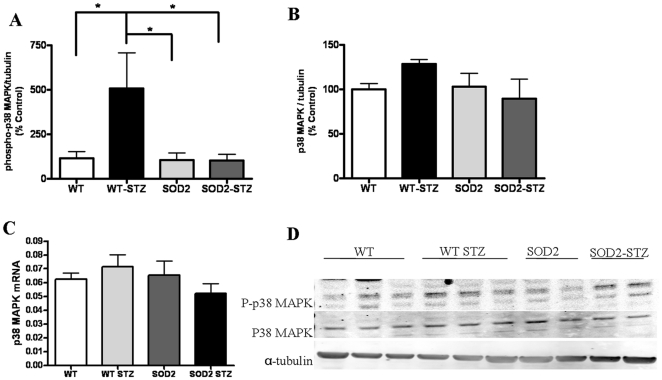
Figure 4. Phosphorylated p38 MAPK significantly increase in WT-STZ mice and recovers in SOD2-STZ mice.
Western blotting analysis of OB tissues from WT, WT-STZ, SOD2, SOD2-STZ mice show: (A) changes in phosphorylated p38 MAPK levels (for WT n = 7 and for WT-STZ, SOD2, and SOD2-STZ n = 5), (B) changes in total p38 MAPK protein levels, (for WT and WT-STZ n = 7, for SOD2 n = 6, and for SOD2-STZ n = 5) (C) QPCR experiment using brain homogenates depict relative changes in mRNA levels of p38 MAPK, six mice in each group and (D) representative western blot from OBs homogenates from 1 week vehicle or STZ treated 2-4-month-old mice. The results are normalized to α-tubulin. Statistical analysis: One way ANOVA followed by Dunnett's post test. ** p<0.01, *p<0.05.

