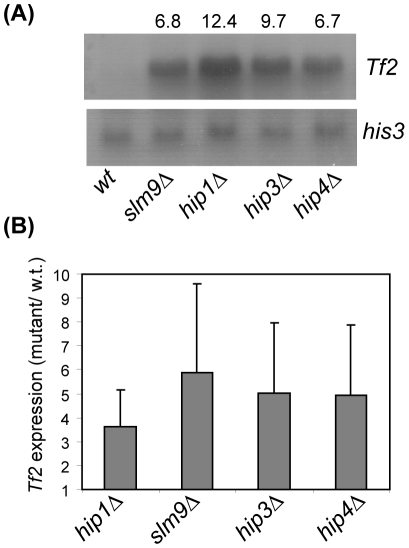
Figure 5. Hip4 represses the expression of Tf2 retrotransposons.
(A) Total RNA was prepared from the indicated strains and subjected to northern blotting with the indicated probes with his3+ mRNA serving as a loading control. The fold increase in Tf2 mRNA levels relative to wild type cells was determined by Phosphor Imager analysis and is indicated above the lanes. (B) Tf2 mRNA levels were determined in the indicated strains using quantitative (real-time) RT-PCR analysis. Data are the mean of three experiments and error bars indicate ± SD.

