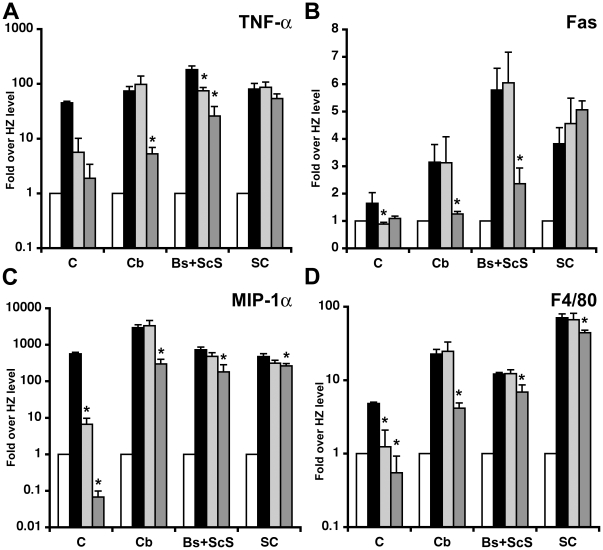
Figure 5. Disease marker gene expression in the CNS of AAV-treated GM1 mice.
Untreated GM1 mice (black bars), and AAV-T GM1 mice (light gray bars) were sacrificed at the humane endpoint defined by >20% loss in body weight, or at 52 weeks of age for AAV-TC GM1 mice (dark gray bars), and HZ mice (white bars). Total RNA was isolated from cerebrum (c), cerebellum (Cb), brainstem+subcortical structures (Bs+ScS), and spinal cord (sc) and used for real-time PCR quantification of TNF-α (A), Fas (B), MIP-1α (C), and F4/80 (D) expression levels. Average fold induction over normal (HZ levels) was calculated for each tissue. Error bars correspond to 1 SEM. * indicates statistical significance with a p-value<0.05 in Student's t-test.

