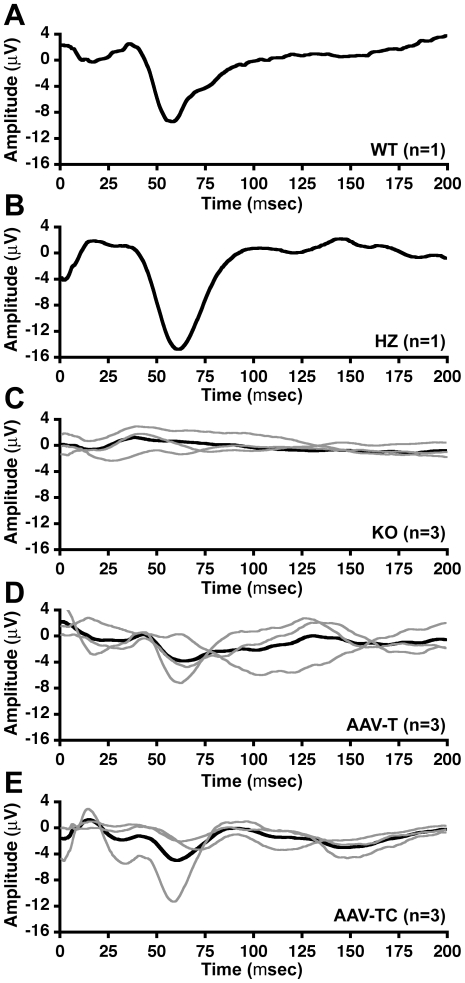
Figure 7. Effect of AAV treatment on visual function in GM1 mice.
Visual evoked potentials were measured in (A) wild type, (B) HZ, (C) untreated GM1, (D) AAV-T GM1, and (E) AAV-TC GM1 mice. Group sizes are indicated on the graphs. (C–E) Gray lines show the results for each mouse in the group. Black lines represent the group average.

